1. Context
When demand goes up, the operation needs to respond
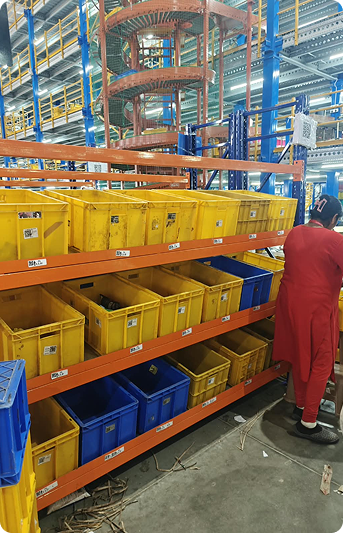
Blinkit’s warehouses hold thousands of products that need to be picked, sorted and dispatched quickly.
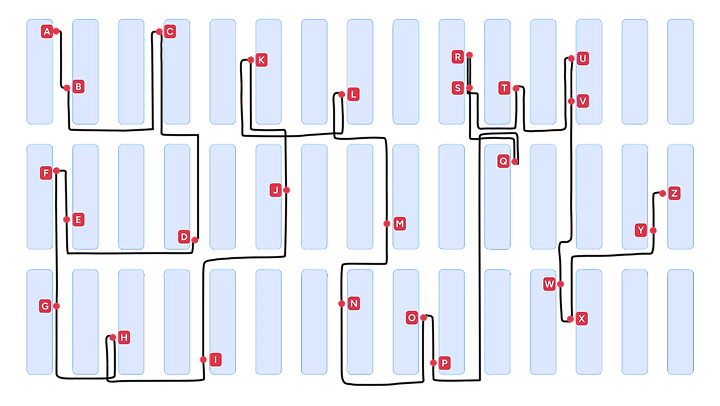
The existing process was organised around individual stores’ demand. Pickers would collect multiple SKUs for one store, often travelling across 25–35 locations to complete a single picklist.
This made picking slower and physically demanding, while picking errors created a dependency on downstream quality checks.
I worked on redesigning this process around Item-Level Picking (ILP) and Put-to-Light (PTL) segregation — changing how items were picked, moved and finally sorted into store-wise orders.
2. The problem
We were optimising picking around stores,
not around the warehouse
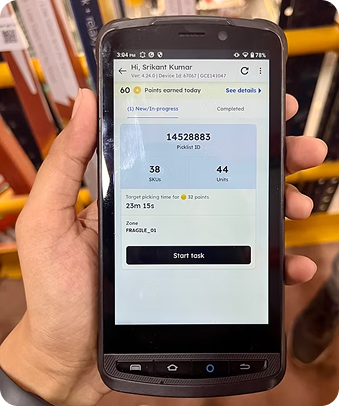
In the existing workflow, pickers received a store-level picklist.
They had to collect all the SKUs required by one store before moving on to the next. A typical picklist could contains 38 SKUs/ 44 units, spread across 25–35 different locations in the warehouse.
This created three problems:
Pick path and time
Pickers covered 25–35 locations per picklist, increasing effort and time.
Picking Errors
Increase in picking errors due to picking multiple SKUs at a time.
QC Dependency
High dependency on QC to check errors in picked quantity.
Problem statement
How might we reduce picker movement and errors without compromising store-level accuracy?
Store level picklist
3. The opportunity
What if we stopped picking for stores?
Instead of asking a picker to find every SKU required by one store,
we explored a different model:
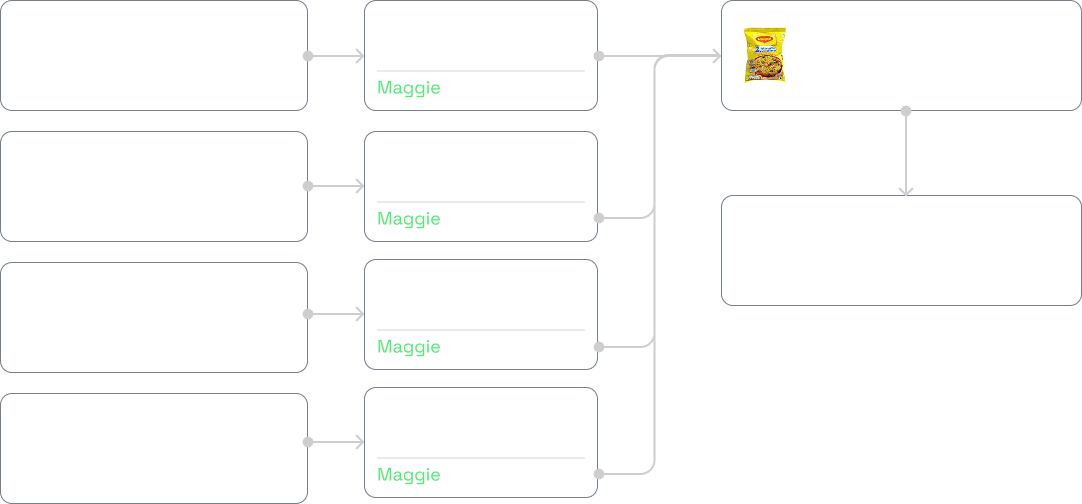
Pick by item, sort by store.
Pickers could collect larger quantities of a smaller number of SKUs
from nearby locations and consolidate them for multiple stores.
This dramatically reduced unnecessary movement.
But it created a new problem:
If we no longer sort items by store during picking, how do we
accurately separate them later?
That question led us to Put-to-Light (PTL).
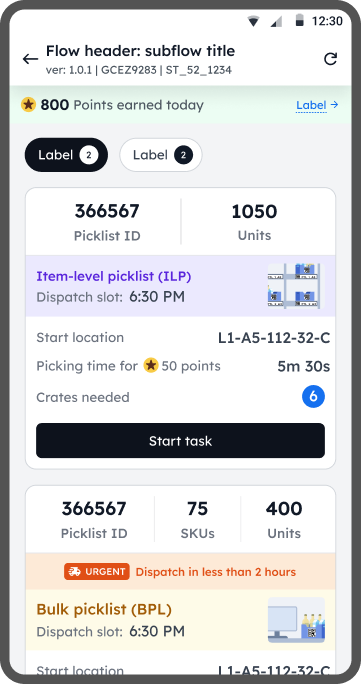
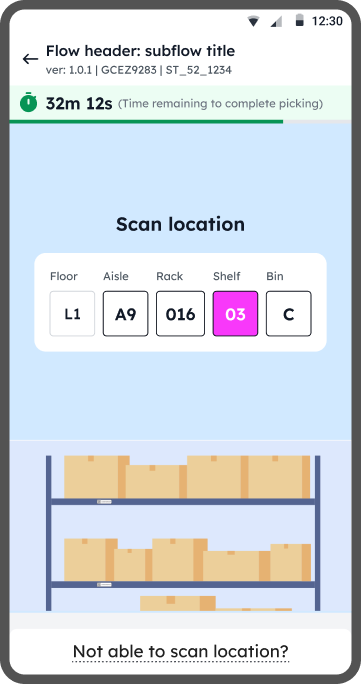
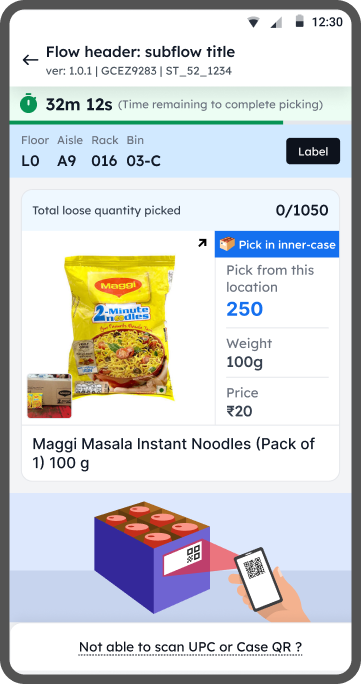
Item level picklist:
PTL (Put to light) Segregation
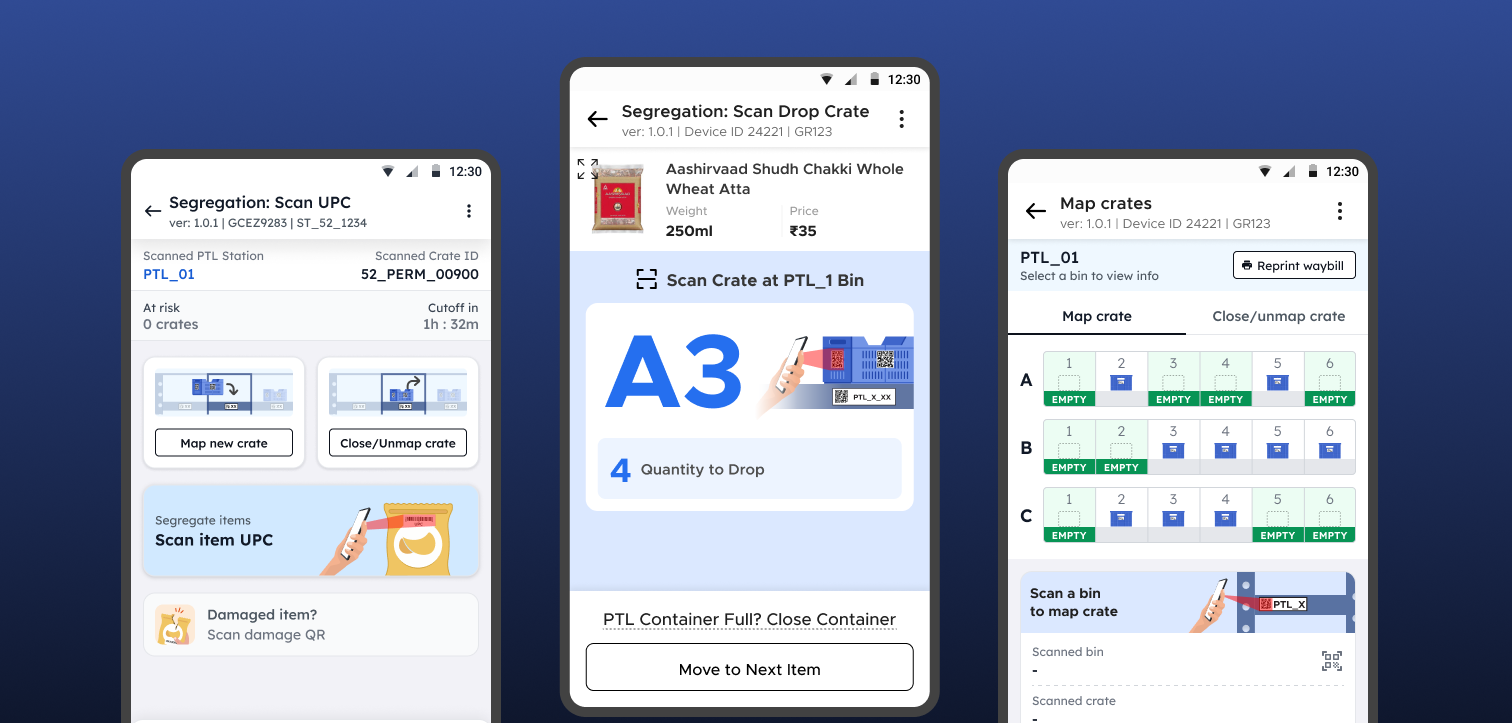
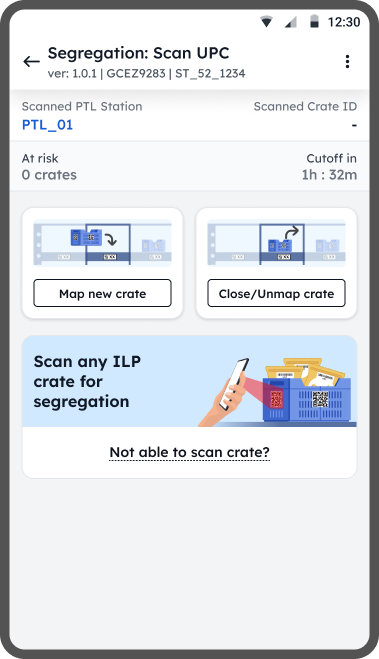
Once the crates are transported to the segregation (PTL) area, the segregator has to pick any crate and start segregating items based on store. User can start with any item they see first in the crate.
Key tasks for PTL segregator:
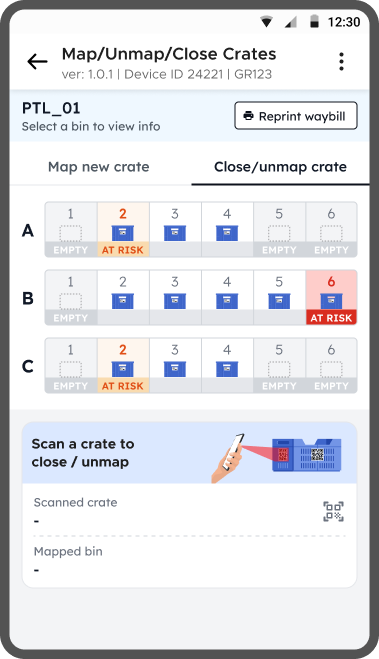
- Map/Unmap crate to Store
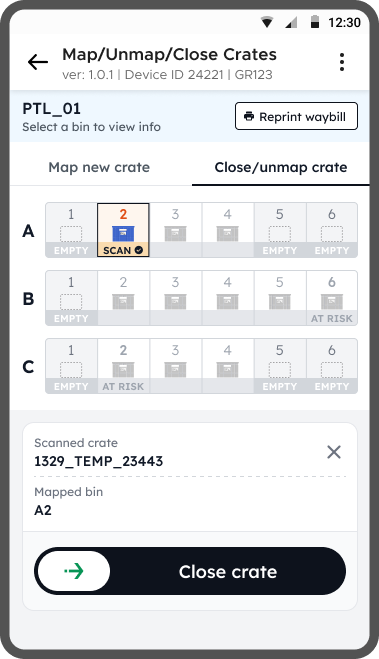
- Close full crates
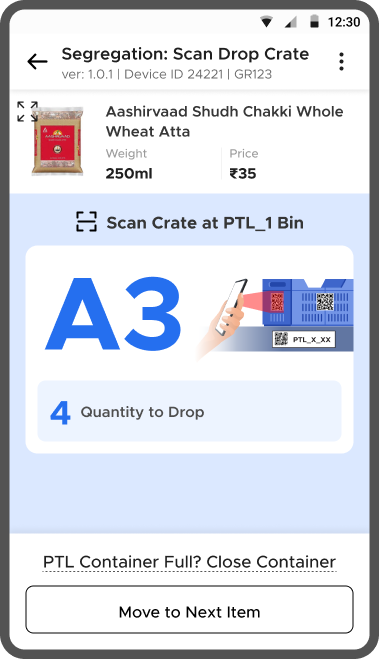
- Segregate Item
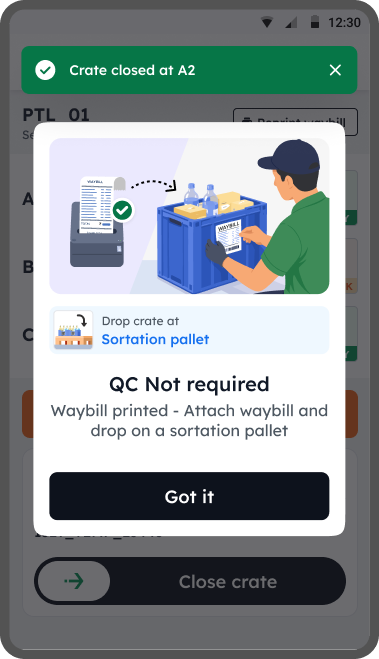
- Print Waybill
PTL Segregation
Phase 1
Pigeonhole setup with Hand Held Devices (HHD)
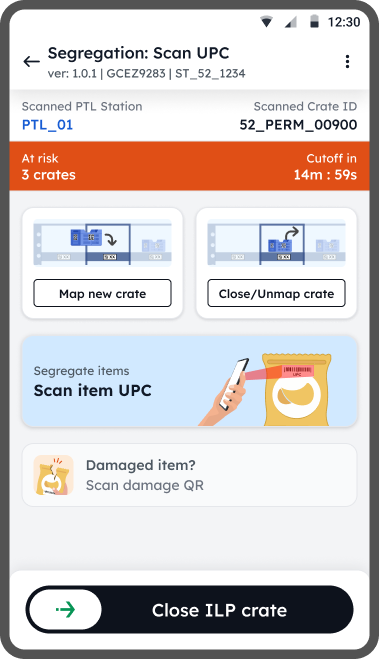
The PTL setup is costly, before committing to that setup we wanted to test the waters by simulating the PTL setup on HHD with Pigeonhole racks.
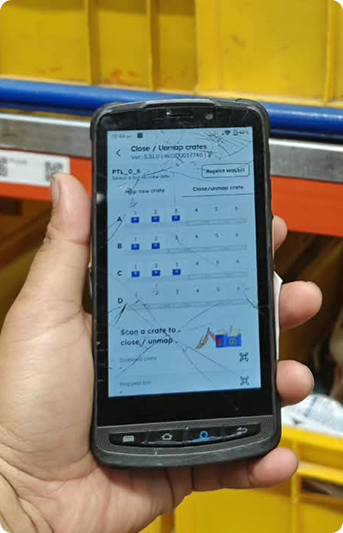
HHD Flows
1. Item Segregation flow
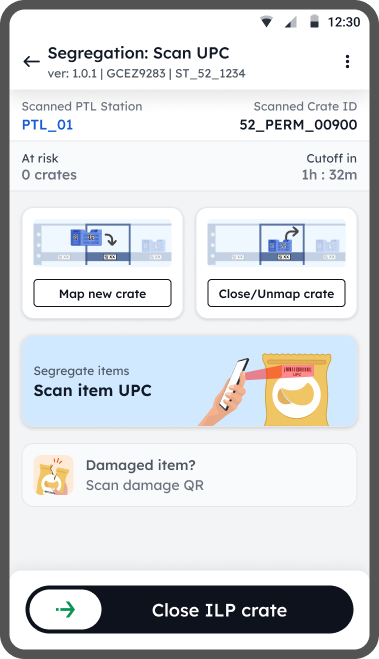
2. Close crate flow
PTL Segregation
Phase 2
Ring Scanner & PTL Setup
After validating the pigeonhole setup for item-level picklists and PTL-based sortation, we introduced a ring scanner to remove dependency on handheld devices, increasing worker’s efficiency.
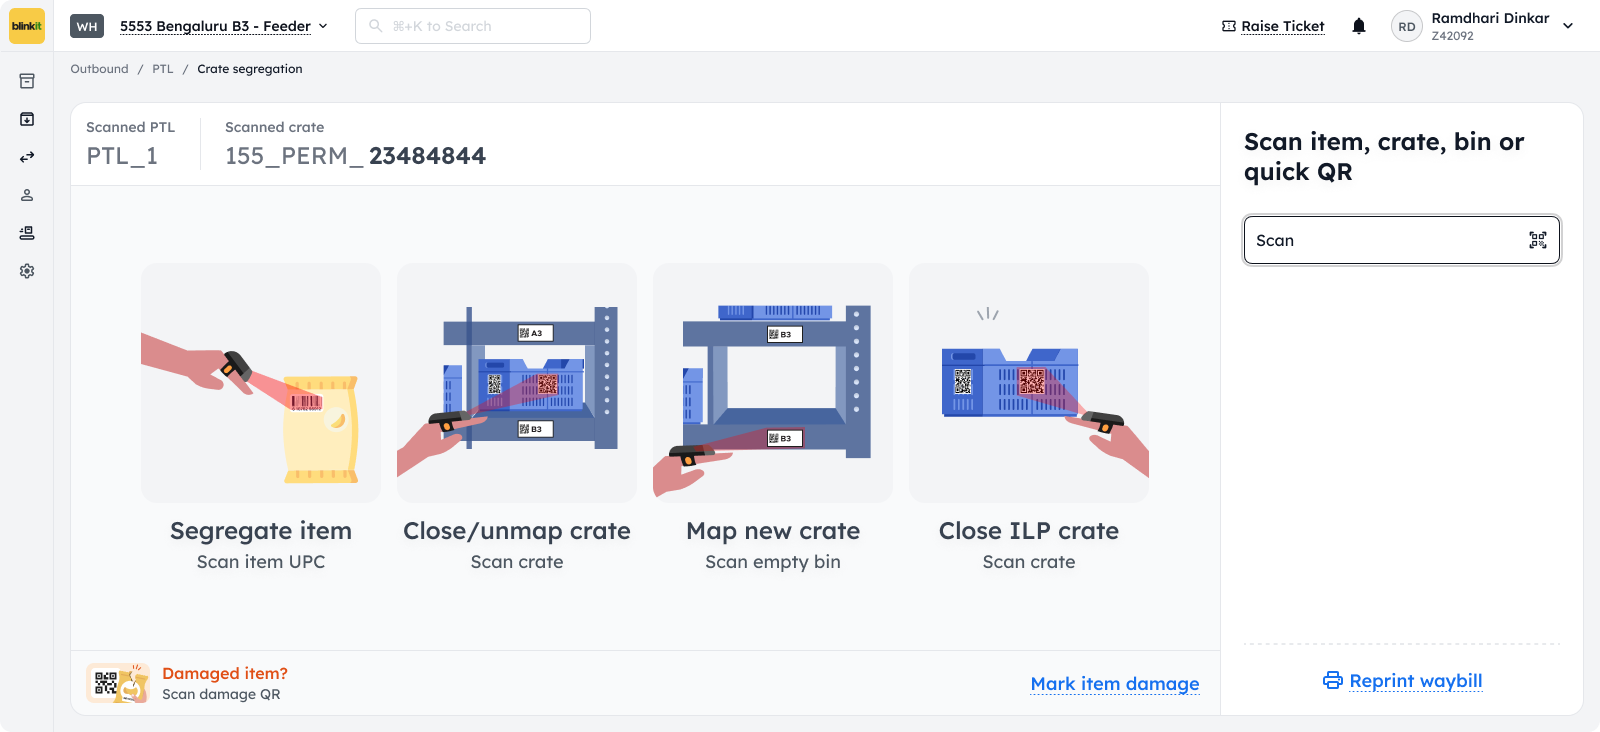
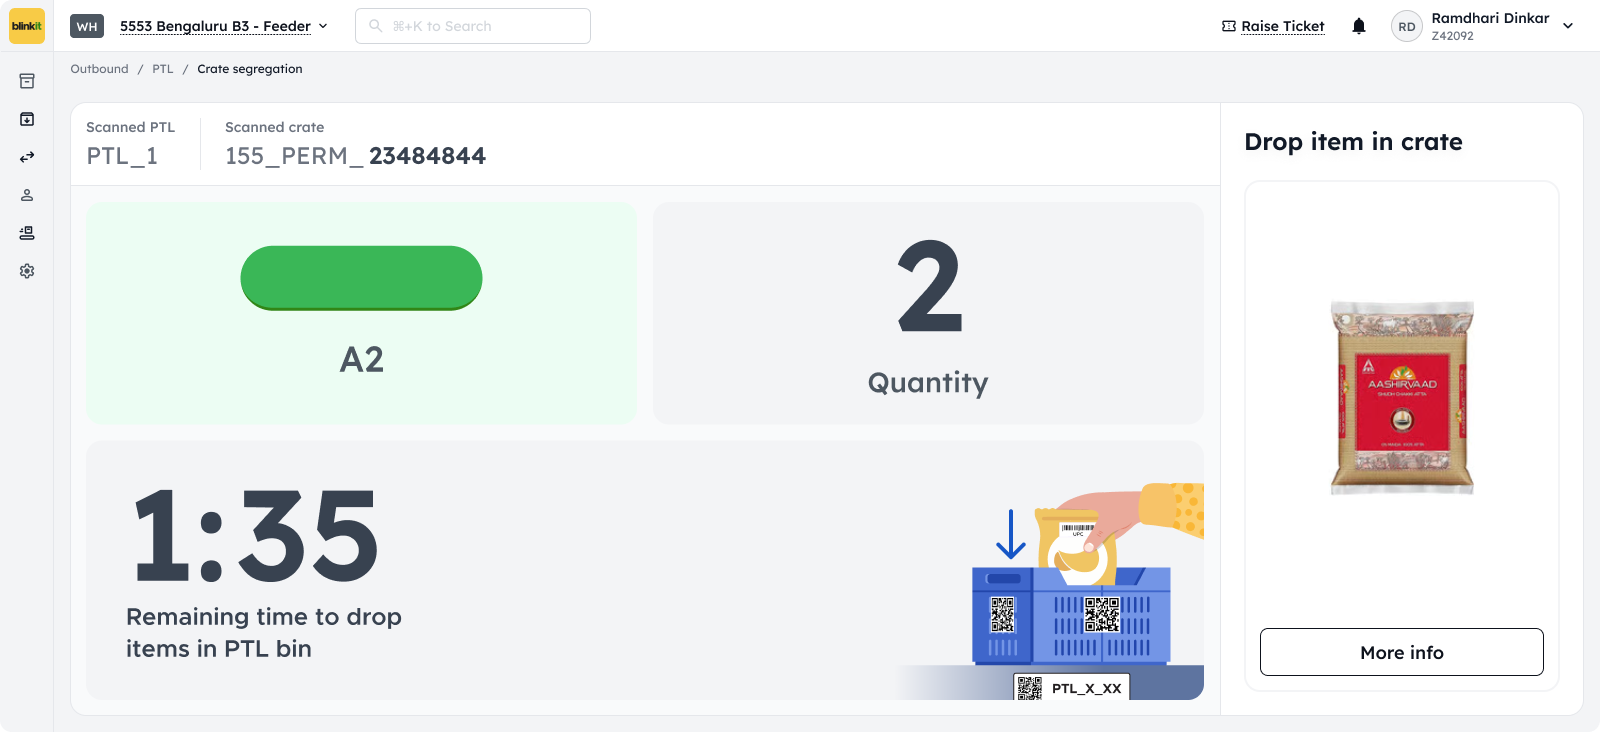
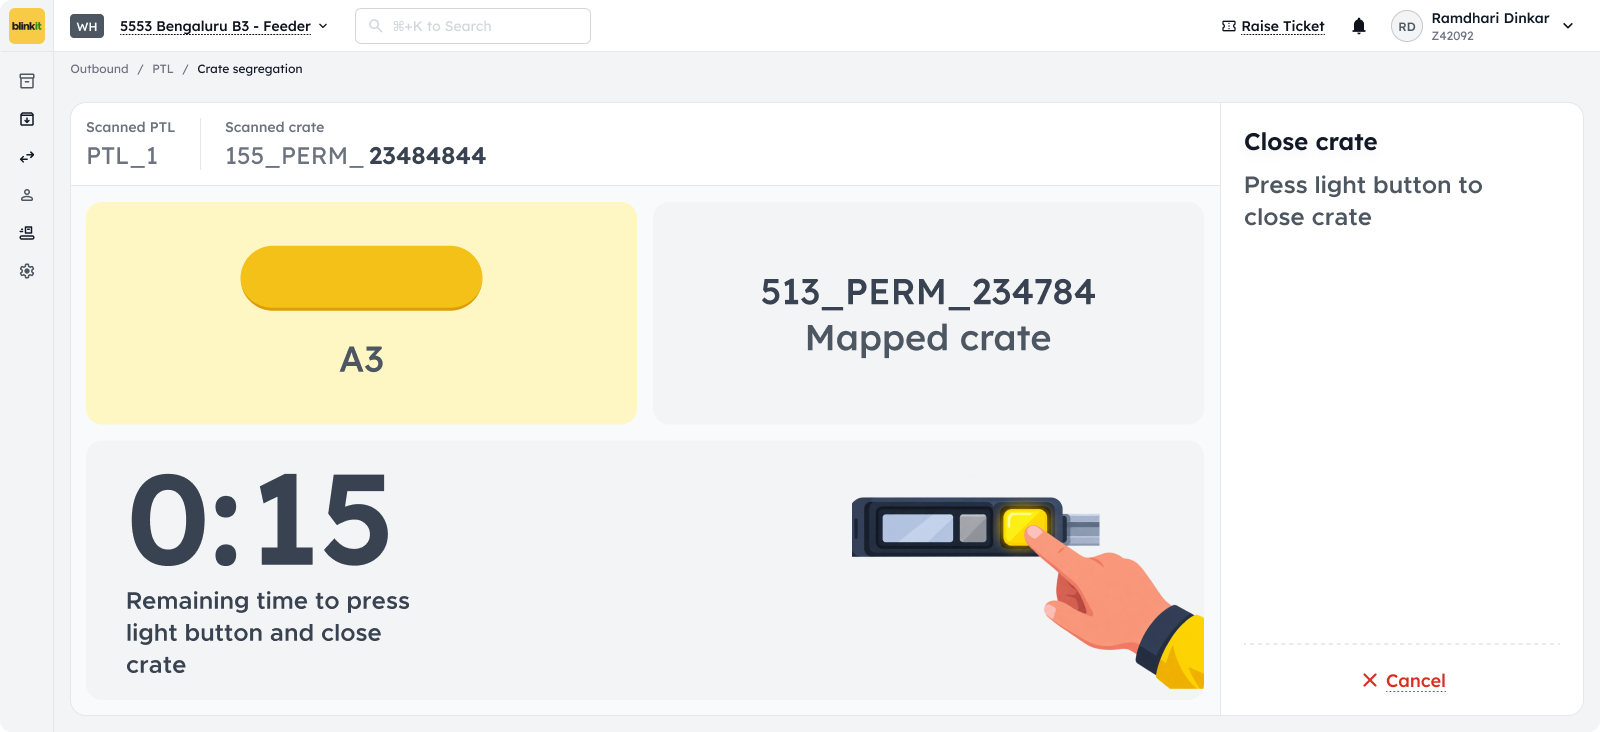
A PTL setup consists of a light which also acts as a confirmation button, and a small display to show count/quantity. Using ring scanner, the worker scan the item at which point the light in PTL bin lights up indicating the drop bin along with the quantity of item to be dropped.
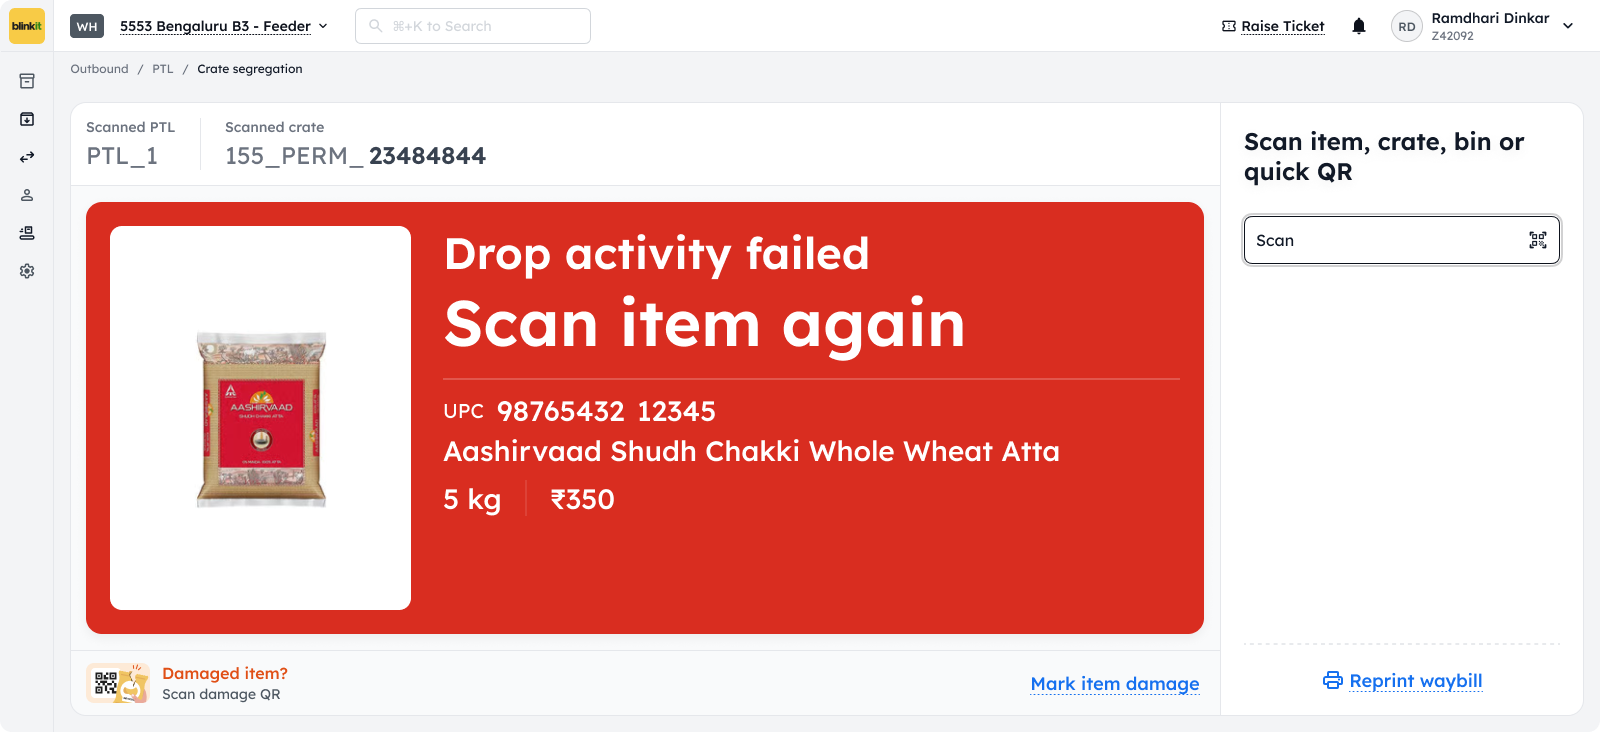
On screen flows for segregation
4. Outcome
25.7%
Increase in items picked per hour per picker (IPP), improving overall picking efficiency
Improved OTIF rates
for picking and dispatch processes